eSight Application Manager

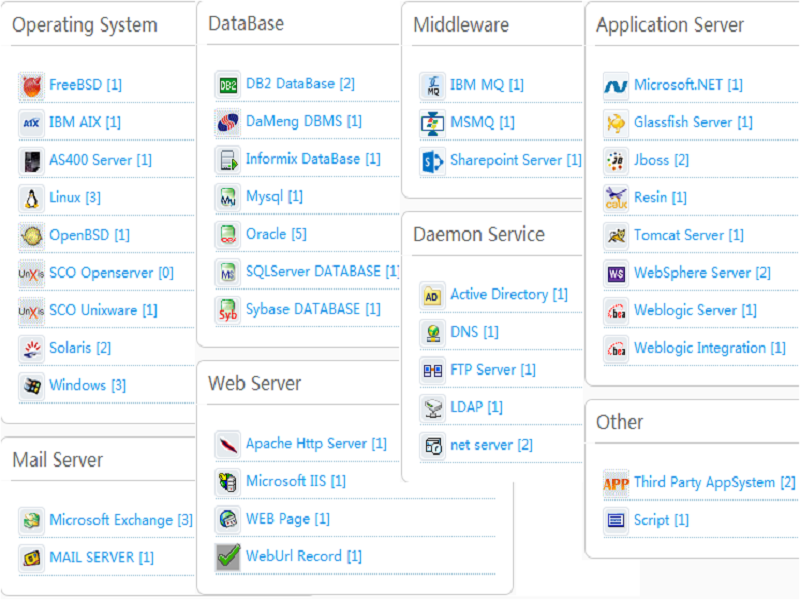
Provides central, unified monitoring of application layer systems, including OS, middleware, databases, web servers, and related Service Level Agreement (SLA) metrics in real time.

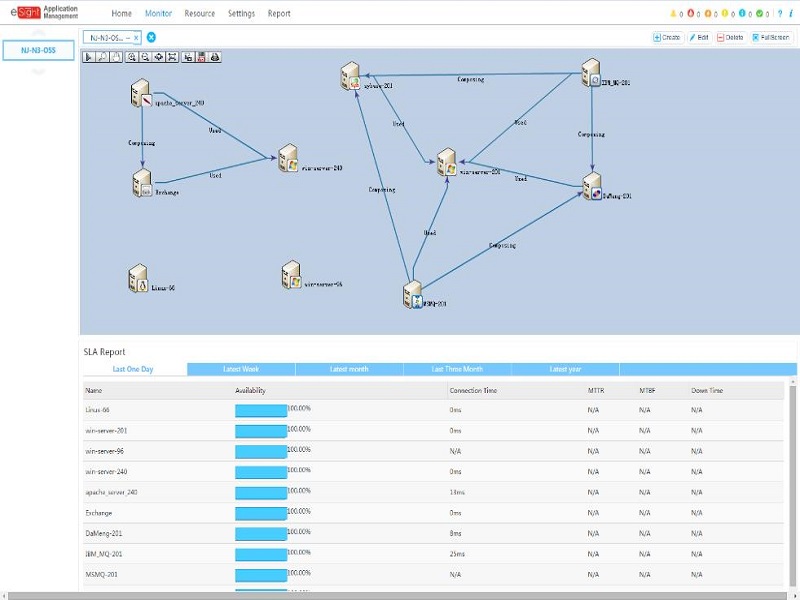
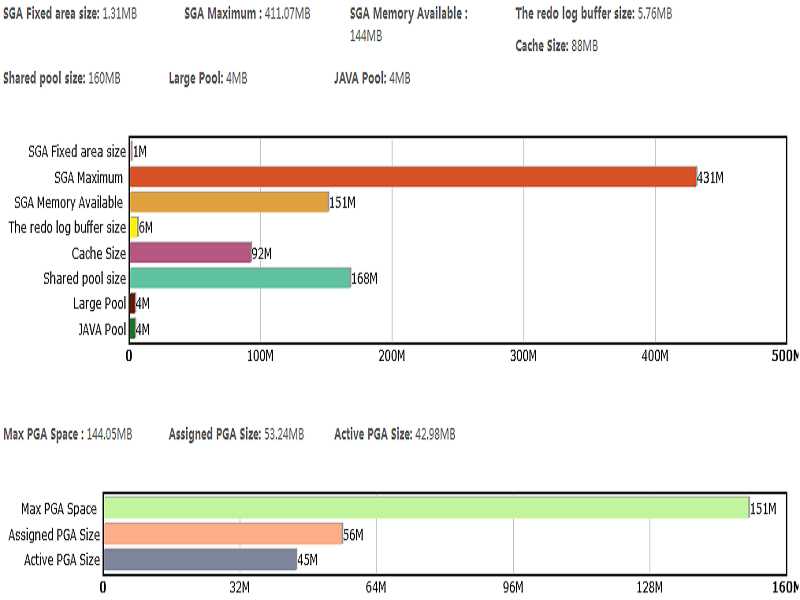
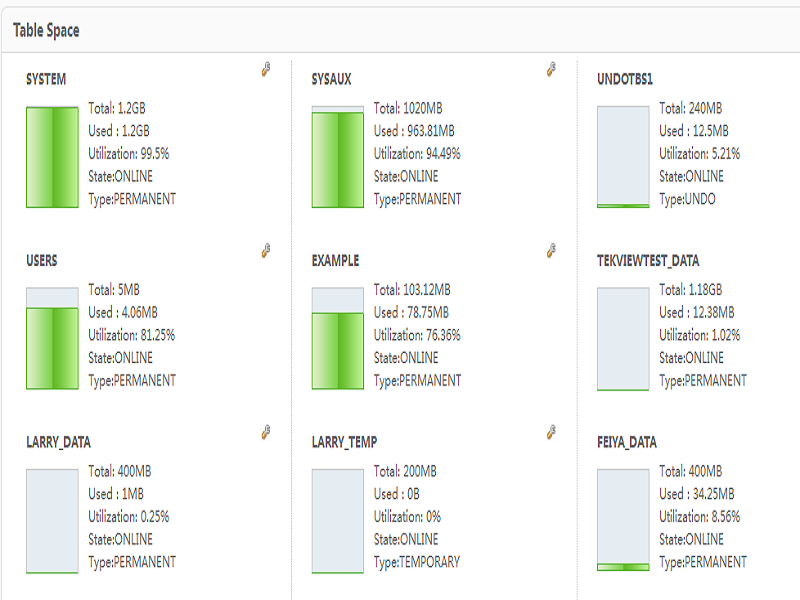
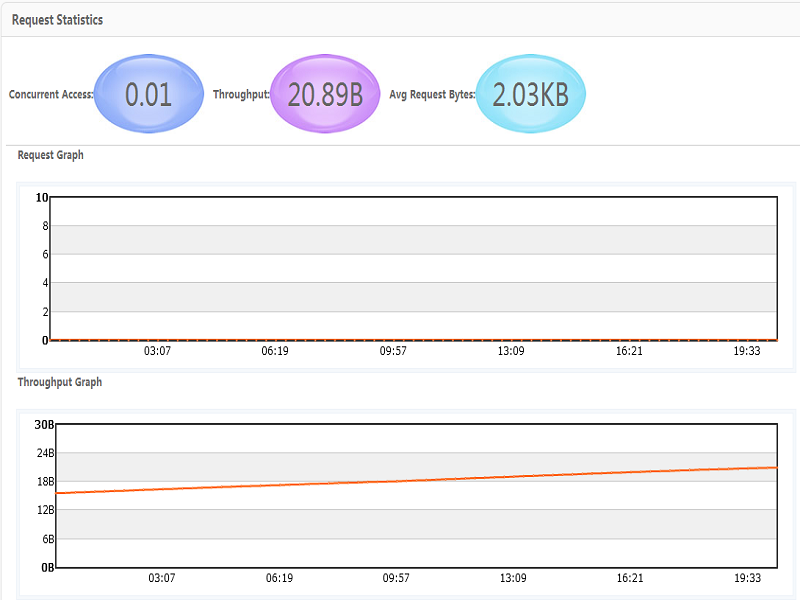
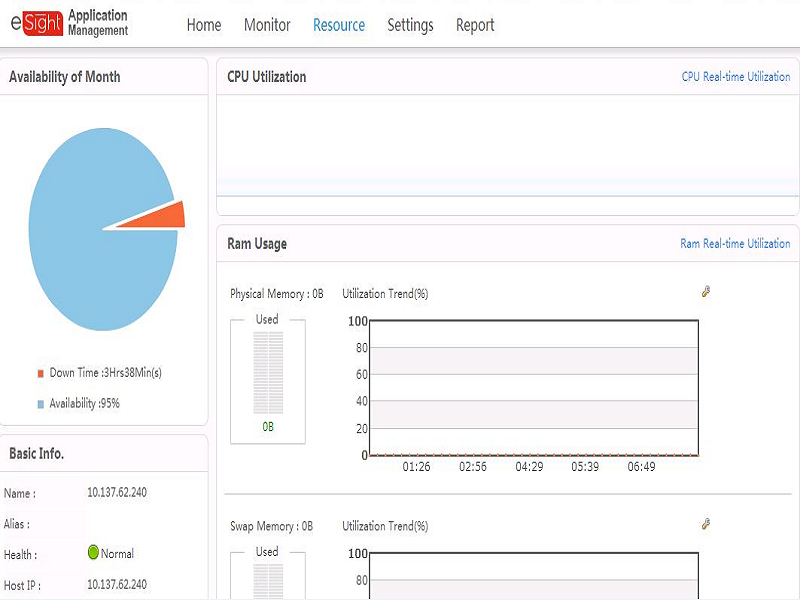
Visual interfaces present managed objects in topology — hosts, databases, and middleware — displaying key performance indicators including CPU and memory utilization, session and message statistics, URLs, number of connections, and process details.

With eSight Application Manager, administrators can manage application performance based on accurate, up-to-date information to ensure resilient access to applications and optimize the ROI from enterprise ICT infrastructure.

Monitor and manage application layer operations — system software, middleware, databases, and web apps to ensure responsive application performance and optimize ROI

Key Features

Unified management of application layer systems
  • Provides unified monitoring and management of Operating Systems (OS) middleware, databases, web applications, and application layer configuration and performance settings
  • Supports major IT operating systems: Windows, Linux, Solaris, IBM AIX, AS400/OS400, HP Unix/Tru64, and FreeBSD
  • Application servers and middleware: Microsoft .NET, Office SharePoint Server, MSMQ, Oracle Application Server, JBoss, Apache Tomcat, WebLogic, IBM WebSphere, and Websphere MQ
  • Databases: Oracle, MySQL, Microsoft SQL Server, IBM DB2, Sybase, and Informix
  • Web applications: Apache HTTP Server, Microsoft IIS Server, Microsoft Exchange Server, Active Directory, Ping, Telnet, SNMP, DNS, and FTP/SFTP, PHP and HTTP URL monitoring
Service status monitoring
  • OS monitoring tracks utilization of CPUs, disks, disk I/O, and specified processes affecting services
  • Database monitoring tracks requests, connection times, query operations, and statistics on connections, threads, memory size, database tables, transactions, query/cache hit ratios, request/cache hit ratio, and table locks
  • Middleware monitoring collects detailed statistics on service threads, sessions, message channels, and messages
  • Application monitoring collects statistics on availability, transactions, active time, service response time, web applications, and thread pools
  • Web server monitoring collects statistics on availability, response time, total traffic, total access traffic, concurrent access traffic, active threads, idle threads, throughput, and average number of bytes contained in requests
Service-oriented views
  • Services are associated with key supporting infrastructure and resources; visual representations in topology enable administrators to quickly locate faults
  • Status and key performance statistics — uptime availability, Mean-Time-Between-Failures (MTBF), and Mean-Time-To-Repair (MTTR) — are displayed graphically to give administrators holistic views of services to help analyze O&M efficiencies and performance trends
Log management Centrally monitors, manages, and analyzes application logs in real time, including network and security logs (Syslogs), system logs (Eventlogs), UNIX logs (Errpt), and key database logs, helping administrators leverage logs to detect and respond to service fault conditions in a timely manner
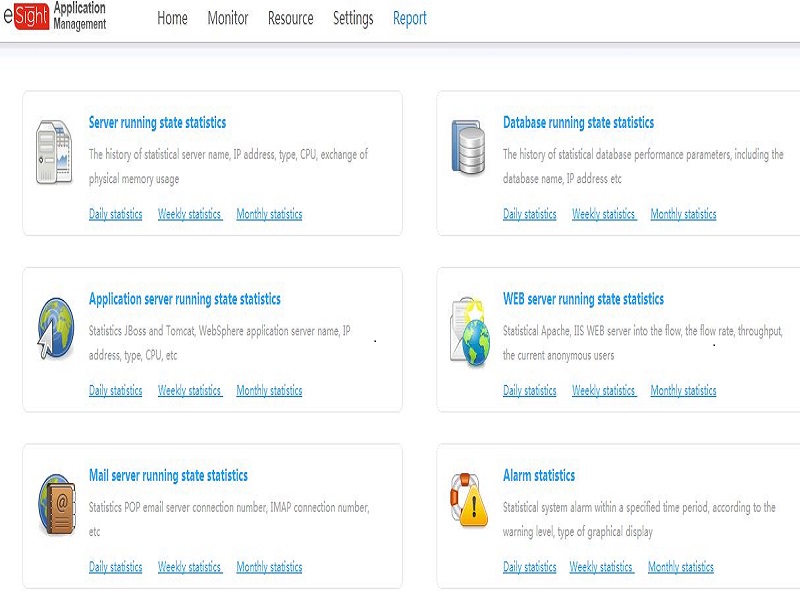
Application report statistics Provides standard and customizable reports of application performance statistics, resource utilization statistics, performance comparisons, trend analyses, and uptime availability, improving O&M efficiencies and helping administrators identify and locate faults

Algunas de nuestras REPRESENTACIONES