eSight Platform
Huawei eSight Platform supports unified management of storage devices, servers, applications, switches, routers, firewalls, WLANs, equipment room facilities, Passive Optical Networks (PONs), wireless broadband trunk devices, video surveillance devices, IP phones, and videoconferencing devices. eSight provides functions including unified view, resource management, topology, performance, and intelligent configuration for heterogeneous devices. eSight also supports customization of third-party devices and NBI for alarms. These functions constitute a unified management system for customers and ensure lower O&M costs and higher efficiency.
Specifications
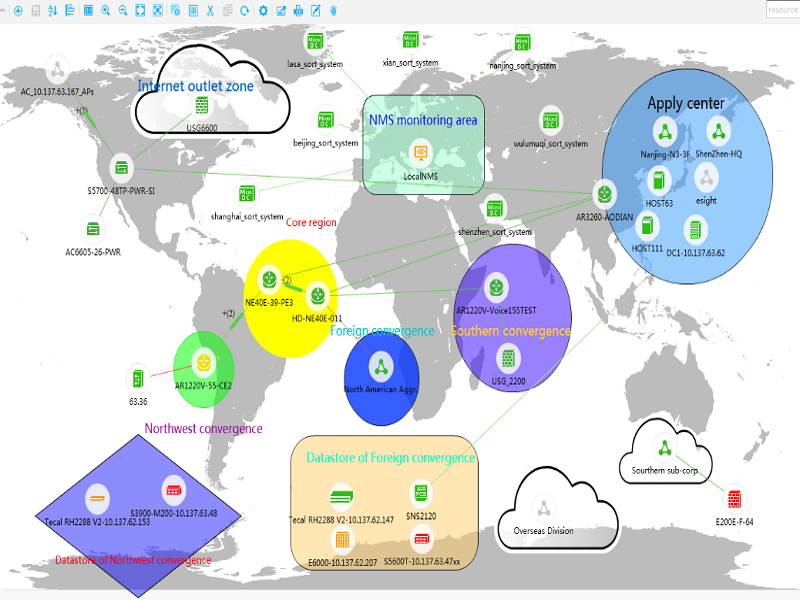
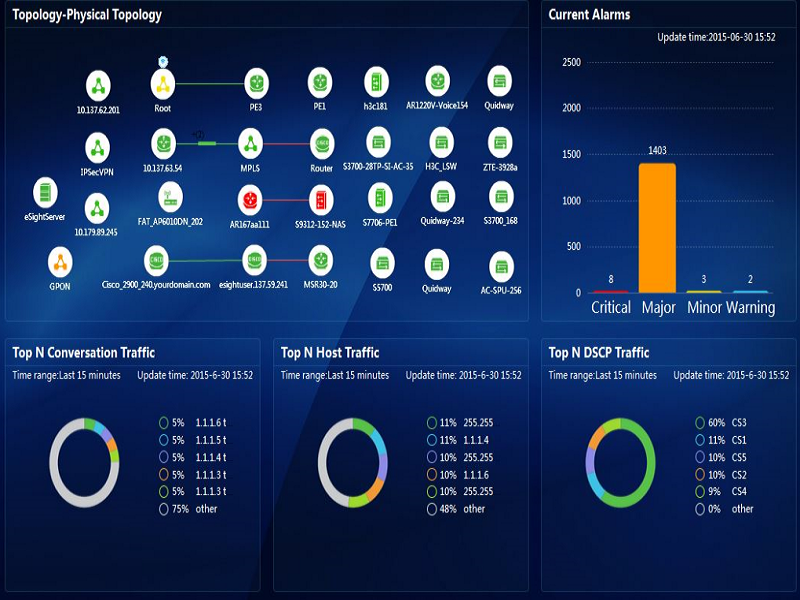
Unified View
Displays KPIs of enterprise ICT devices, helping administrators monitor the status of critical devices and of device links over the entire network. In this way, administrators can identify device, link, and port faults and take actions to ensure the normal operation of the ICT system.
| Unified Portlet |
|
| Unified Topology |
|
| Large-Screen Display |
|
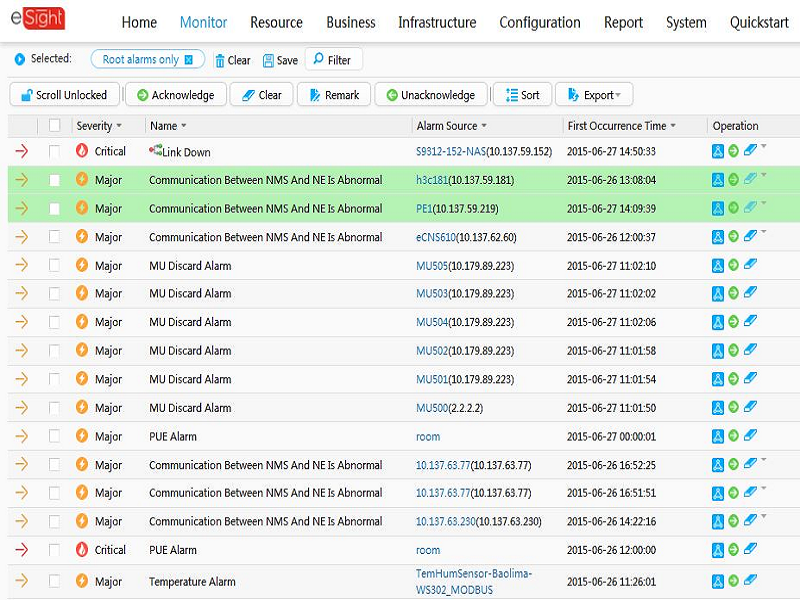
Centralized Alarm
Identifies alarm severity levels, such as critical, major, minor, and warning using different colors or words. eSight recognizes multiple alarm severity levels and informs administrators on the panel and by sound alert, email, and SMS, enabling quick and accurate fault-locating and troubleshooting.
| Network-Wide Alarm Monitoring |
|
| Alarm De-Duplication |
|
| Multi-Dimensional Notification |
|
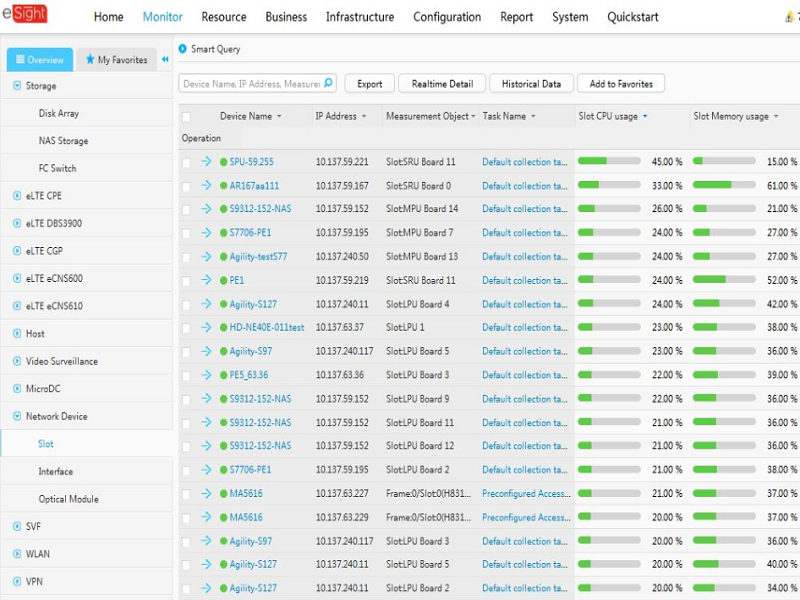
Performance Monitoring
Monitors the performance indicators of ICT devices, such as CPU usage, memory usage, device connectivity, device response time, port traffic, network connectivity rate, and utilization.
| Performance Collection |
|
| Performance Monitoring Settings |
|
| Historical Performance Query |
|
| Threshold-Crossing Alarm |
|
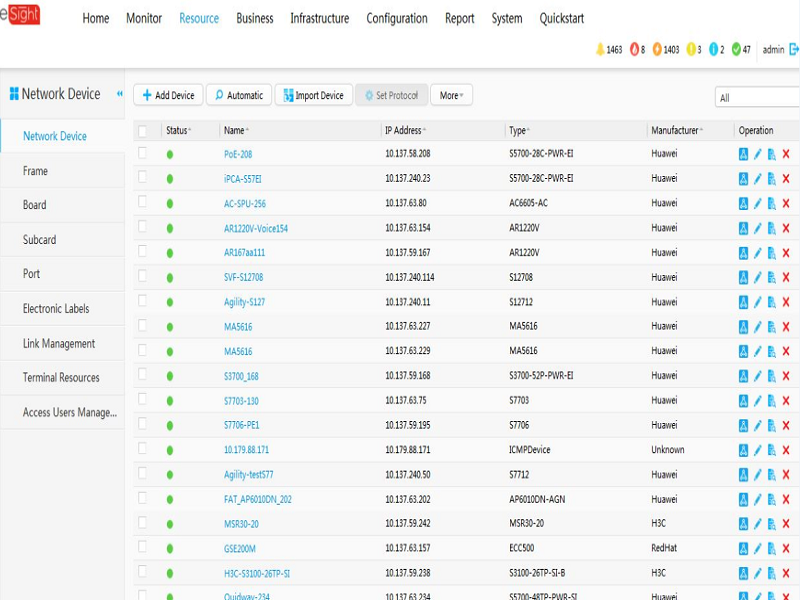
Unified Configuration
Supports batch configuration of ICT devices on the enterprise network, allowing O&M personnel to easily configure devices with the same or diversified configurations in batches, speeding up service deployment.
| Batch Configuration and Deployment |
|
| Service Parameter Delivery |
|
| Device Software Upgrade |
|
| Configuration File Management |
|
Unified Report
Displays statistical data about the performance, resources, and capacity of enterprise ICT devices in various formats, helping IT administrators identify resource bottlenecks and performance trends, laying a foundation for IT investment and system optimization.
| Customization by Dragging |
|
| Big Data Analytics |
|
| Scenario-based Display |
|
| Mobile Experience |
|
Mobile Management
Provides an App that can be installed on mobile devices, enabling maintenance anytime and anywhere.
360-Degree Monitoring
- Displays KPIs on mobile devices and provides optimization suggestions
Fault Diagnosis
- Quickly identifies the root cause based on faults reported by users and checks the user log to determine whether the faults have been handled
Algunas de nuestras REPRESENTACIONES