eSight WLAN Manager

Powerful eSight Management Software for provisioning, monitoring, and optimizing performance of wireless networking infrastructure.

WLAN Manager’s graphical software interfaces and unique data visualization technologies simplify accurate, responsive management:

  • Visual wizards make configuration and provisioning of services fast and error-free
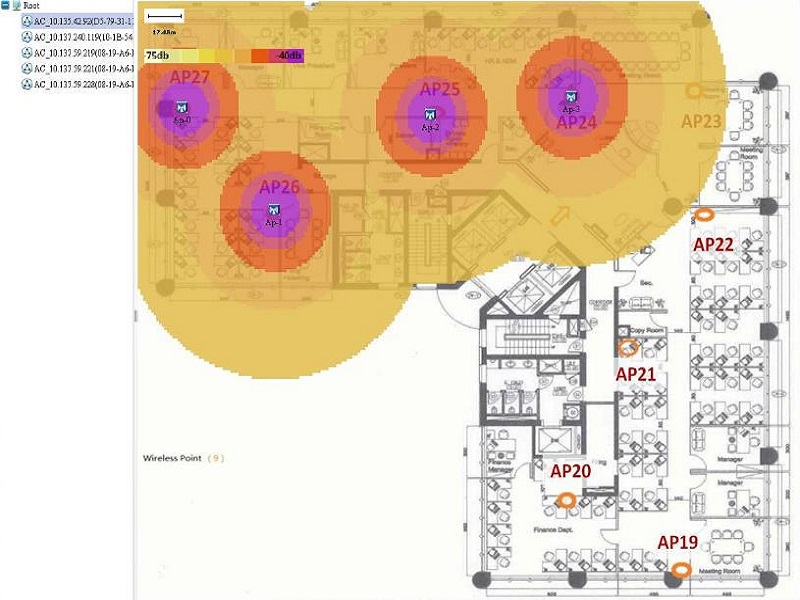
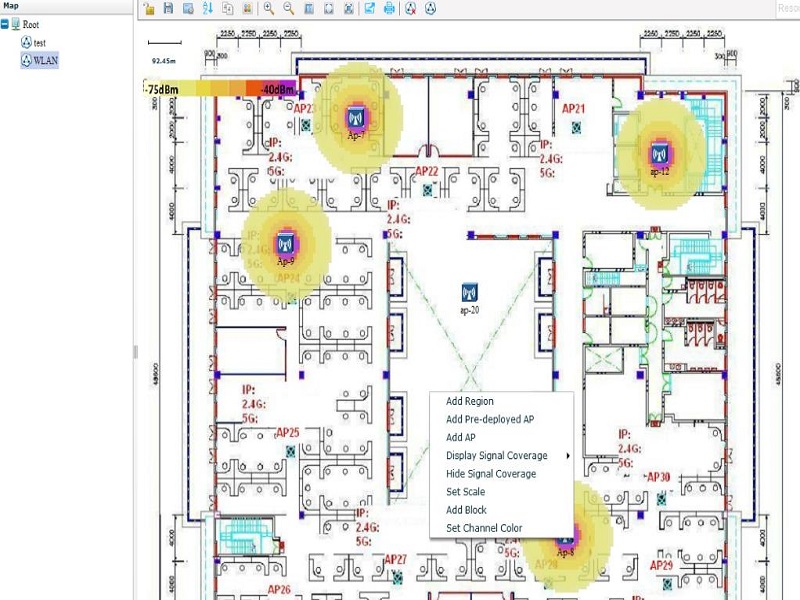
  • Views of ACs and APs in topology overlaid with utilization, performance, and interference data provide instant insight into WLAN status
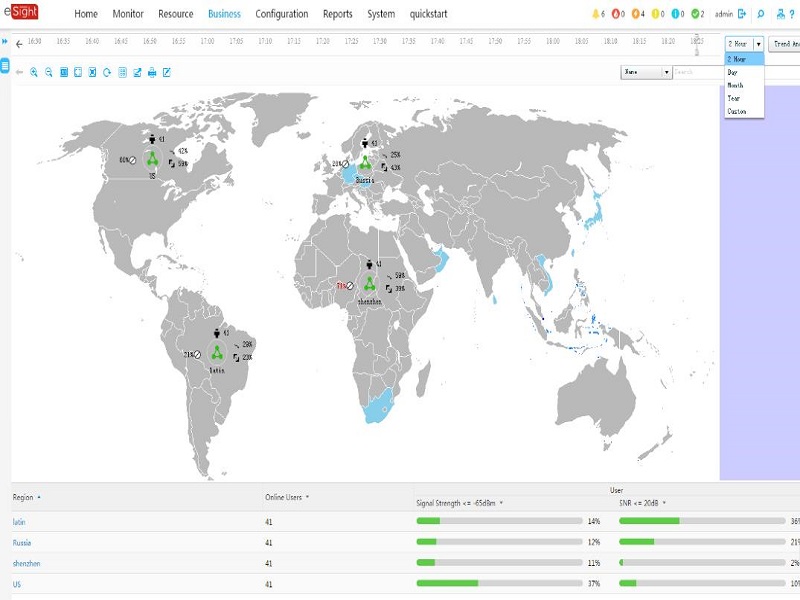
  • View data across the enterprise, by region, or on a floor in an office building

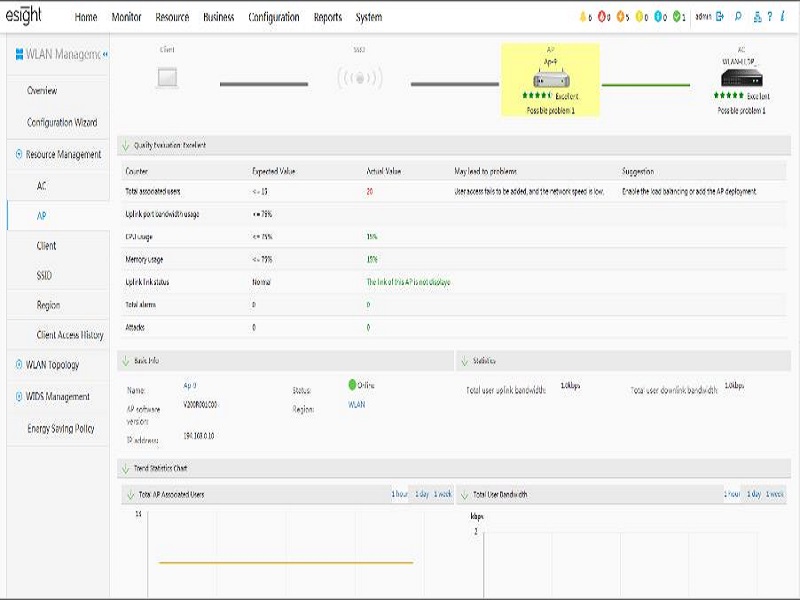
Automated alerts, diagnostics, and performance management ensure best-in-class wireless services at low cost.

Huawei’s eSight WLAN Manager leverages innovative data visualization technologies to help you deliver high-performance wireless network services at the lowest cost

Key Features

Wireless network optimization
  • Deploys new APs quickly to ensure hotspot coverage and eliminate holes in coverage
  • Enables administrators to quickly switch wireless channels and perform radio frequency calibration in cases where planned channels are occupied by carriers or private APs, or when live network APs are interfered with
One-click fault diagnosis
  • Intelligent diagnostic feature identifies faults affecting user-side Station (STA) devices caused by incorrect configurations, such as OS versions, wireless network adapter settings, and system service settings — improving trouble-shooting efficiency and reducing costs
  • Network quality fault conditions and potential risks caused by Service Set Identifier (SSID), AP, and AC issues are diagnosed in a single click, with resolution suggestions to help administrators respond quickly to issues
Wizard-based deployment Visual wizards are provided for efficient deployment and provisioning operations, including profile-based AP configuration and WLAN service deployment
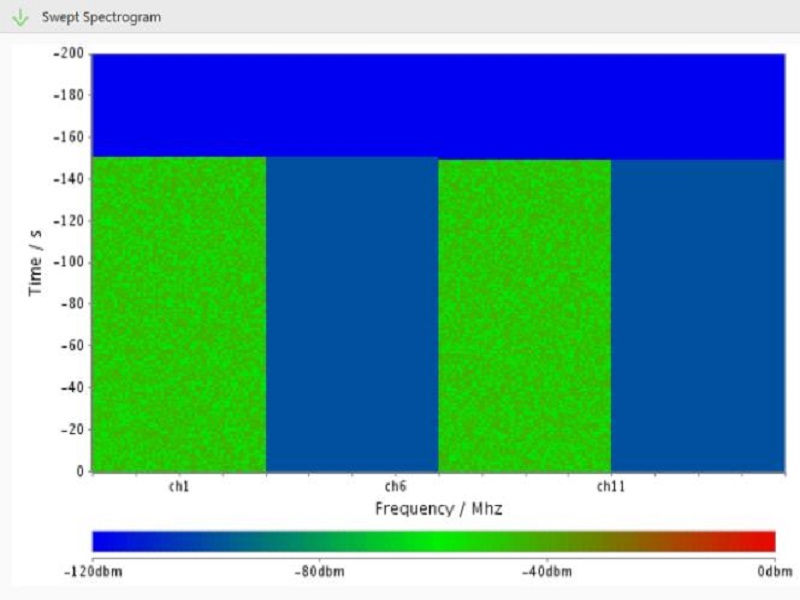
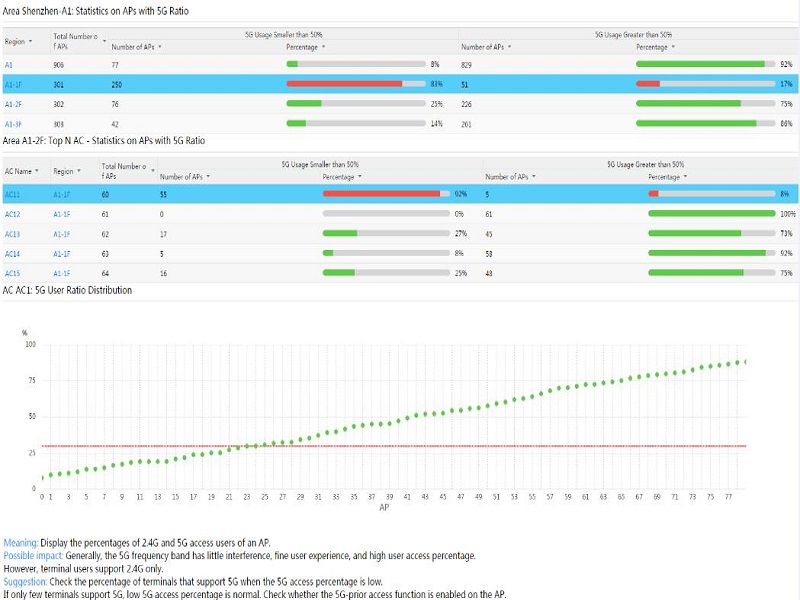
Multi-dimensional data visualization features
  • Innovative data visualization technologies are used to present the most insightful views of ACs and APs in topology
  • Spectrum analysis of interference signals and thermographic representations of AP locations and coverage help identify coverage holes and conflicts
Dynamic monitoring and data modeling
  • WLAN infrastructure is continually monitored in real time; local topology views based on network logic display ACs, APs, users, wireless field strength, and fault conditions by floor; integrated visual management functions enable rapid resolution of WLAN issues
  • Data collected from monitoring devices is statistically cleansed in real time — improving the accuracy and resolution of visual data representations, charts, and thermographs
Wireless intrusion detection Categorizes, identifies, and manages unauthorized clients, interference sources, and cyber attacks based on administrator-defined rules to mitigate wireless network risks
Comprehensive, multi-level reporting
  • Network-wide statistics are collected and presented in visual charts to display top 5 APs, SSIDs, and key device alarms to identify network-wide trends
  • AC-based statistics are displayed in charts showing data and bandwidth utilization, domain information, top 5 alarms, APs, and users
  • AP-based resource statistics include AP physical attributes, WLAN performance KPIs, AP traffic, radio frequency utilization, SSID-based statistics, top 5 alarms, and numbers of APs, Virtual APs (VAPs), and connected STAs based on SSIDs
  • Statistics are also collected by region and location, including ACs, numbers of APs and VAPs, and STAs based on region and location

Algunas de nuestras REPRESENTACIONES