IT Management
Huawei IT Management provides integrated management for storage devices, servers, VMs, applications, middleware, and services, with easy means of querying the capacity, visualized monitoring of performances, and available services. In this way, eSight streamlines the O&M process, which lowers the skill requirements of O&M engineers and ensures stable services for enterprises.
Specifications
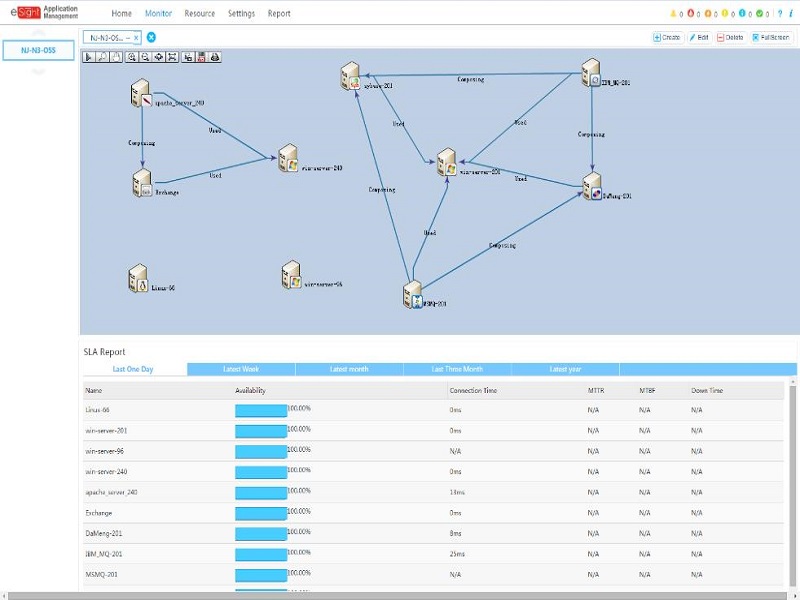
Business Service Management
Adopts a mapping model for services, IT devices, and applications to monitor the performance and availability of IT devices from the service dimension. Therefore, eSight can quickly diagnose fault causes, analyze the affected service scope, and display the overall running status of enterprise services on a large screen, providing optimized IT services.
| Availability Monitoring |
|
| 360-Degree View |
|
| Service and Device Association Topology |
|
Application and Middleware Management
Provides unified monitoring and configuration management over the operating systems, databases, middleware, web applications, and application systems. With intelligent and visualized management of the service system, eSight improves O&M efficiency and lowers the skill requirements of O&M engineers.
| Unified Application Management | Provides unified monitoring and configuration management over mainstream operating systems, databases, middleware, web applications, and application systems, including:
|
| Application Status Monitoring |
|
| Service View |
|
| Log Management |
|
| Application Report Management |
|
VM Management
Provides centralized monitoring over virtualized computing devices for unified monitoring of physical and virtual resources. This function can greatly improve O&M engineers’ efficiency and reduce costs.
| Cluster Management |
|
| Host Management |
|
| VM Management |
|
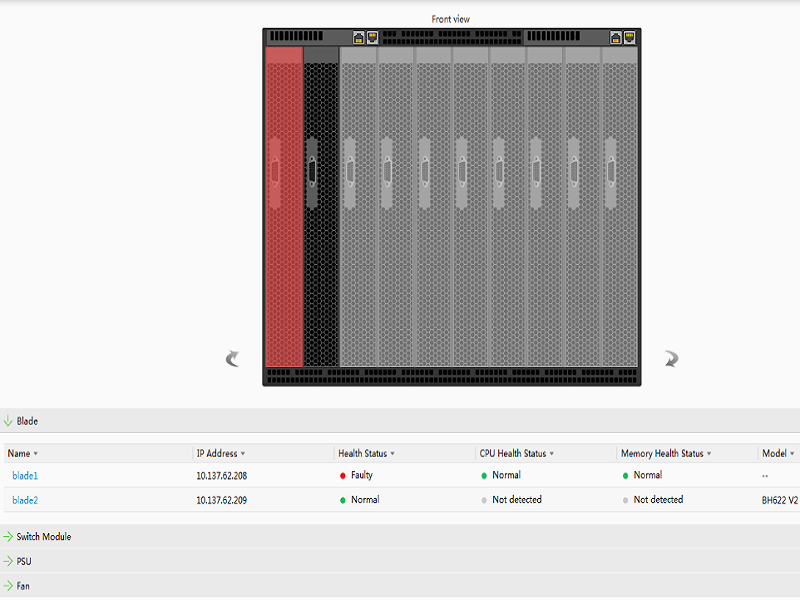
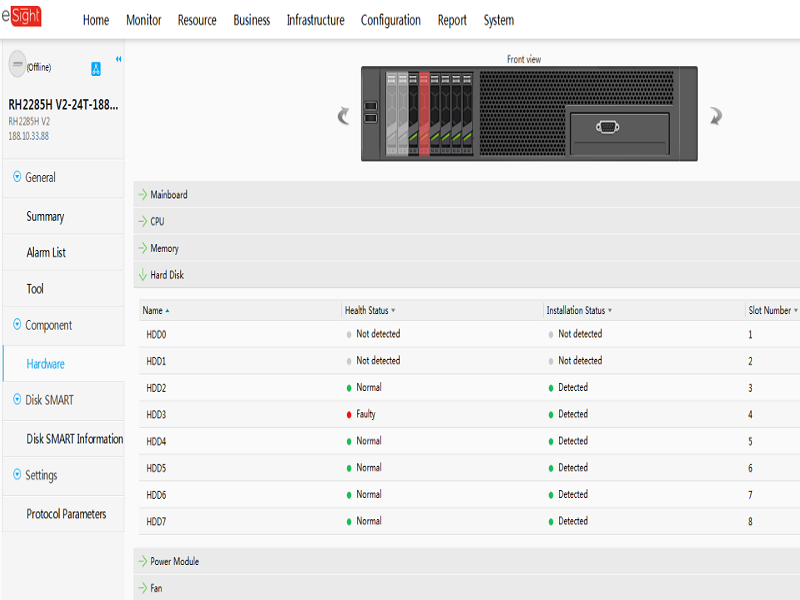
Server Management
Provides enterprise customers with an integrated management solution for operating systems and servers to simplify O&M management of servers and improve O&M efficiency.
| Automatic OS Monitoring |
|
| Hardware Information Management |
|
| Batch Configuration |
|
| Stateless Computing |
|
| Visualized Panel |
|
| Remote Maintenance |
|
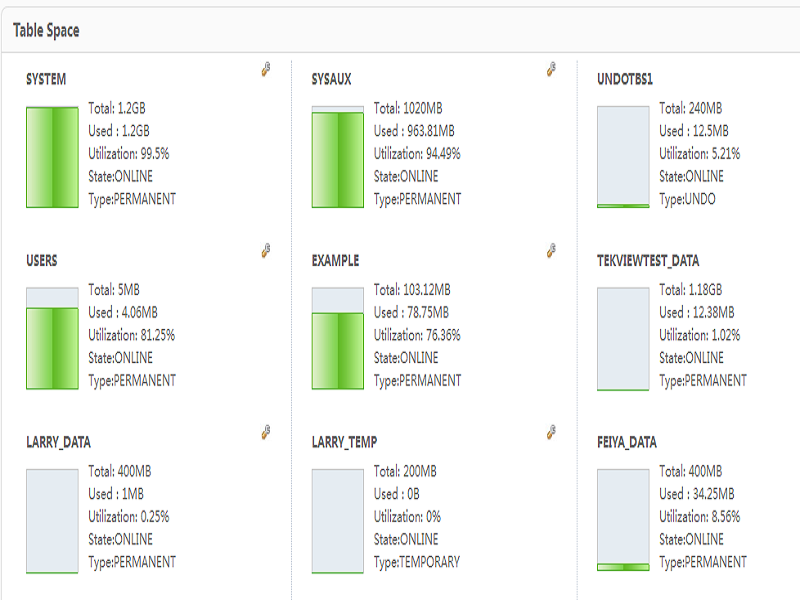
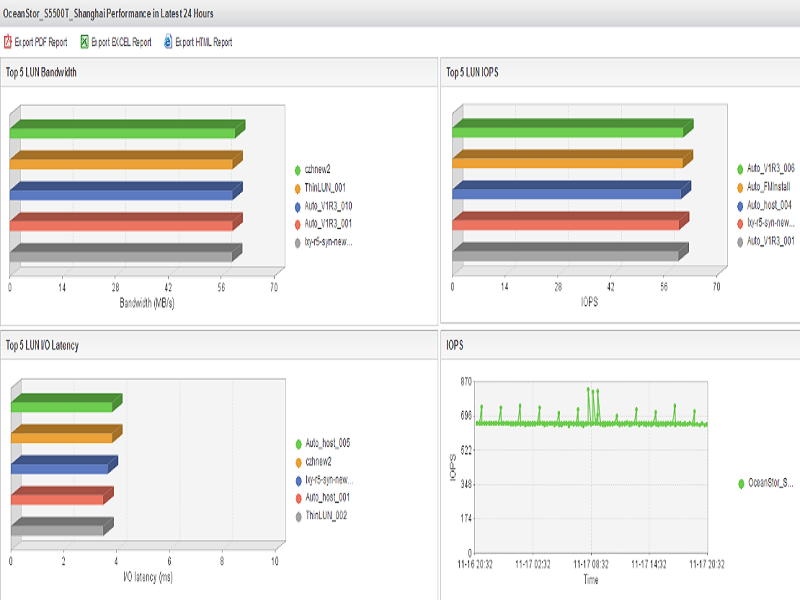
Storage Management
Monitors hosts, VMs, switches, and heterogeneous storage devices on the network in a unified manner. This improves enterprises’ management efficiency and ensures reasonable use of storage resources in the physical and virtual environments.
| Performance Monitoring |
|
| Storage Capacity Analysis |
|
| Storage Network Analysis |
|
| Visualized Resources |
|
| Storage Report |
|
| Health Evaluation |
|
| Heterogeneous Device Management |
|
Algunas de nuestras REPRESENTACIONES